
Find the sustainablechoice for anything you buy.
See the environmental impact of your choice
- Near you
- Verified only
- Real data

Every module, one living ecosystem
Tap any node to jump straight into discovery, impact, alliances, or immersive sanctuary tours — the same routes as the top navigation.
Viungavita home · sustainable living standard
Explore All Modules
Vetted Sustainable Alternatives, Localized.
Describe any product in your own words and enter your ZIP — discover verified B2B and B2C nodes near you.

Curated Discovery · Top Quality

Local Artisan Home · Small Local Business

Organic Groceries · Nearest Local
Three conscious purchase paths for every ZIP search — nearest local, top quality, and small businesses worth supporting.
Impact you can trust.
Global benchmarks from public open datasets — paired with qualitative standards for how Viungavita publishes verified community impact.
Source: Trillion Trees Initiative
25M+
Trees Restored
20-year projection context based on public reforestation datasets — partners vetted for land and watershed stewardship.
Restoration focus
Source: CBD Secretariat (Convention on Biological Diversity)
196
Nations Committed
Global commitment benchmarks from public biodiversity datasets — local partners must meet our certification bar.
Verified eco partners
Source: IRENA
510 GW
Clean Energy Added
Renewable capacity benchmarks from public energy datasets — community brightness compares when real activity data is available in the app.
City-level impact
Source: The Ocean Cleanup
15M+
Ocean Plastic Removed
Ocean recovery benchmarks from public cleanup datasets — Viungavita publishes community totals only after verification.
Audit-first standard
Global Pulse Map
Bright cities · local impact · shared sustainability glow
Together, we build a better tomorrow.
Three vanguard cities set the glow standard. Join verified members mapping conscious choices block by block.
Vanguard city glow
The city that glows the most wins the most.
Amsterdam leads the global sustainability glow at density 4733. San Francisco trails by 0 points.
Audit-first pipeline
From impact review to transparent publication.
Every partner seal follows the same auditable path — impact evidence first, traceable data second, human seal review, then public ledger publication.
- 01Impact audit
Impact Evaluation
Baseline ecological review against sourcing, proximity, and biodiversity criteria before any seal is considered.
- 02Source linked
Data Traceability
Primary documents, calculators, and partner submissions are linked to each score — every number shows its document trail.
- 03Seal review
Seal Verification
Human reviewers validate audit packets and assign Green, Gold, or Diamond tier eligibility before publication.
- 04Public ledger
Transparent Publication
Approved partners appear on the Green-Mapping radar with methodology notes — community counters stay separate from global benchmarks.
Seal tiers · post-audit
Green
Verified baseline ecological standards — entry tier after impact audit clears.
Gold
Documented carbon and biodiversity outcomes with traceable source links.
Diamond
Long-horizon conservation legacy with annual re-audit and public methodology notes.
Impact observatory layers
Forest canopy, marine basins, and audited carbon — in one intelligence view.
The VR Observatory visualizes community-verified restoration layers — V-Oxygen forest corridors, V-Blue marine basins, and traceable carbon ledger entries — calculated from public datasets and partner audit packets.
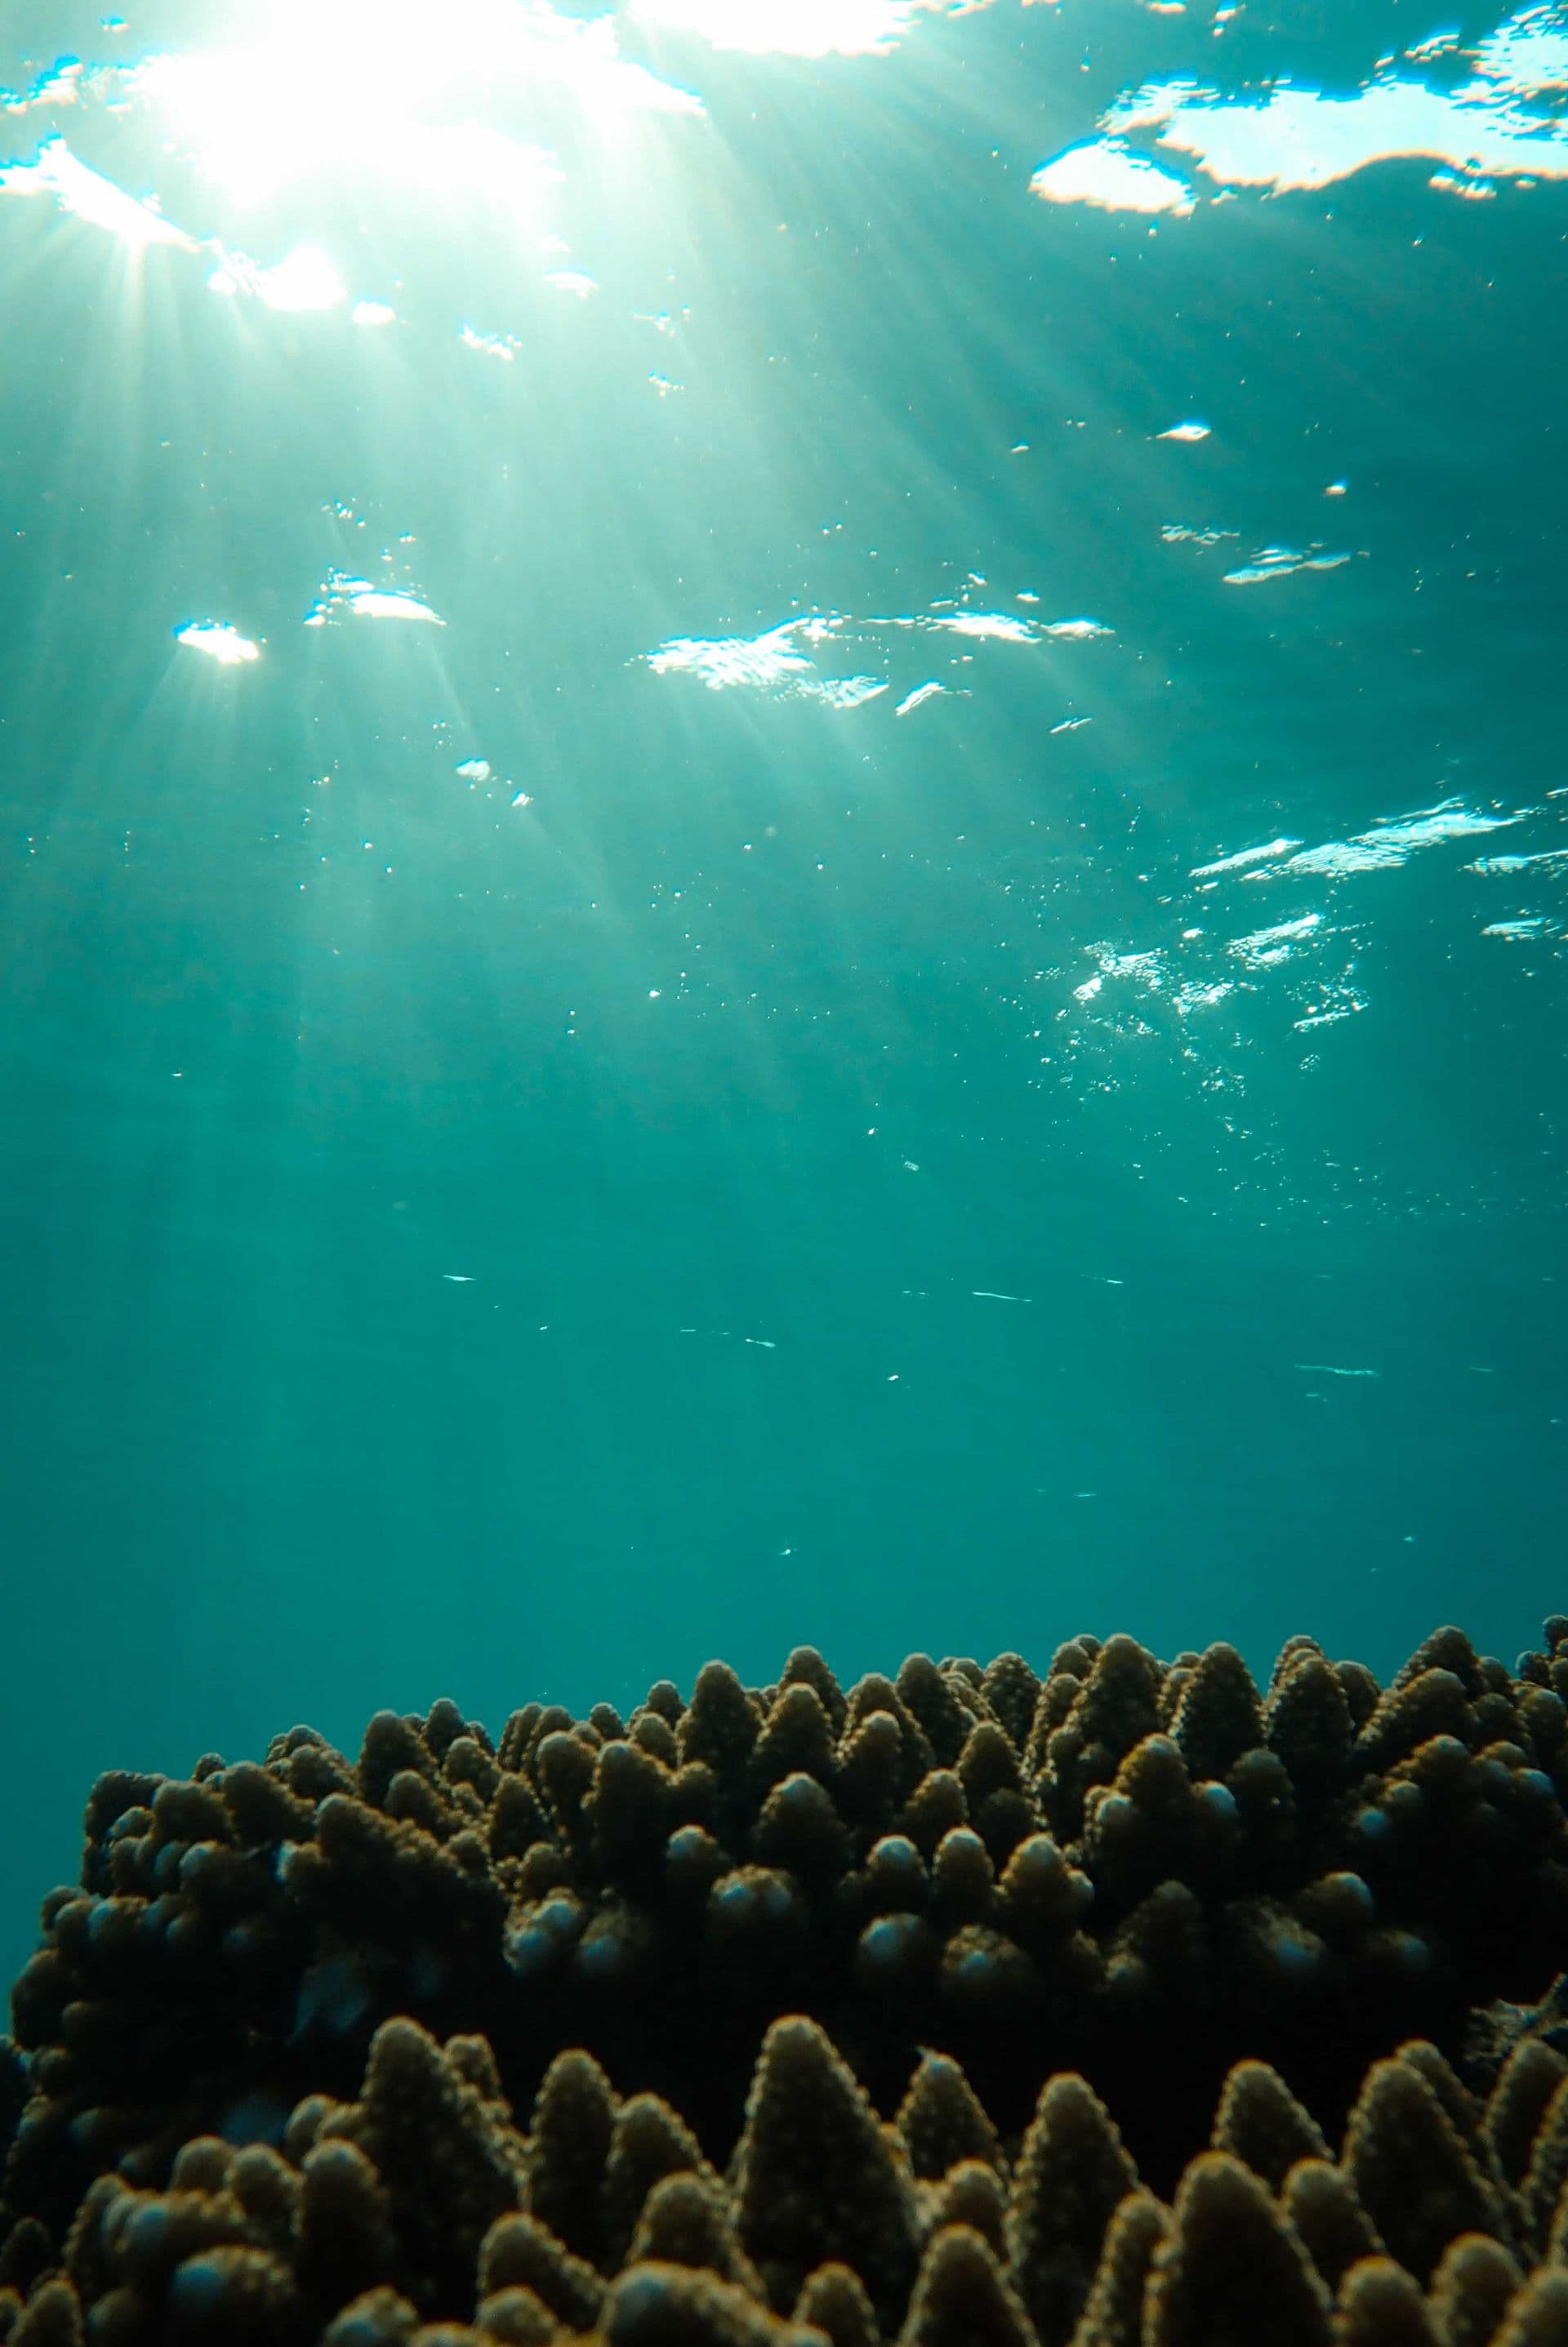
Mission 1 · Equatorial Belt · 0° Thermal Belt
Marine thermal variation monitoring and coral stress analysis across the Equatorial Belt (0° Thermal Belt)
Representative equatorial reef photography · marine restoration context
3D visualization based on satellite telemetry · Sources: NASA Earthdata / NOAA Coral Reef Watch / Copernicus / Global Forest Watch
Representative biome image · Telemetry: NASA Earthdata / NOAA Coral Reef Watch / Copernicus / Global Forest Watch
Observatory layers
Forest & watershed corridors
Canopy density, nursery stewardship, and land-reserve projections — 20-year horizon, source-linked in app.
Marine restoration basins
Reef corridors, coastal cleanup context, and Manifest-7 habit layers — educational estimates from public ocean datasets.
Audited carbon credits
Community impact counters published only after verification — kept separate from global benchmark cards on this landing.
Making sustainable choices easier — together.
Join verified members mapping conscious commerce block by block.